Interested in learning more about visualizations and business intelligence? Check out the work I do for LinkedIn Learning, eCornell, and Code Magazine!

I’m an instructor for several courses in the LinkedIn Learning library that focus on business intelligence applications such as Microsoft’s Power BI and AWS QuickSight. I recorded the videos comprising these courses, and I also authored, developed, and designed the creative content and projects within these courses. LinkedIn Learning is a paid subscription service, but it’s a great investment to learn more about technology and business skills as a subscription allows you to access unlimited courses in the online library. Below are the links to these courses.
Advanced Microsoft Power BI: http://www.linkedin.com/learning/advanced-microsoft-power-bi
Reducing data headaches from Advanced Microsoft Power BI by Helen Wall
Power BI Data Methods: https://www.linkedin.com/learning/power-bi-data-methods
The Power BI ecosystem from Power BI Data Methods by Helen Wall
Data Dashboards in Power BI: https://www.linkedin.com/learning/data-dashboards-in-power-bi
Power BI ecosystem from Data Dashboards in Power BI by Helen Wall
Power BI Dataflows Essential Training: https://www.linkedin.com/learning/power-bi-dataflows-essential-training
Optimizing your data with Power BI dataflows from Power BI Dataflows Essential Training by Helen Wall
Learning Amazon Web Services (AWS) QuickSight: https://www.linkedin.com/learning/learning-amazon-web-services-aws-quicksight
Understand your data with QuickSight from Learning Amazon Web Services (AWS) QuickSight by Helen Wall
Microsoft and AWS are investing a lot of resources into developing their business intelligence applications. There’s always something new for all of us to learn!

I also facilitate courses for Cornell University’s online executive certificate program eCornell on data science and predictive analytics subjects by utilizing technology like R, Python, and Excel.

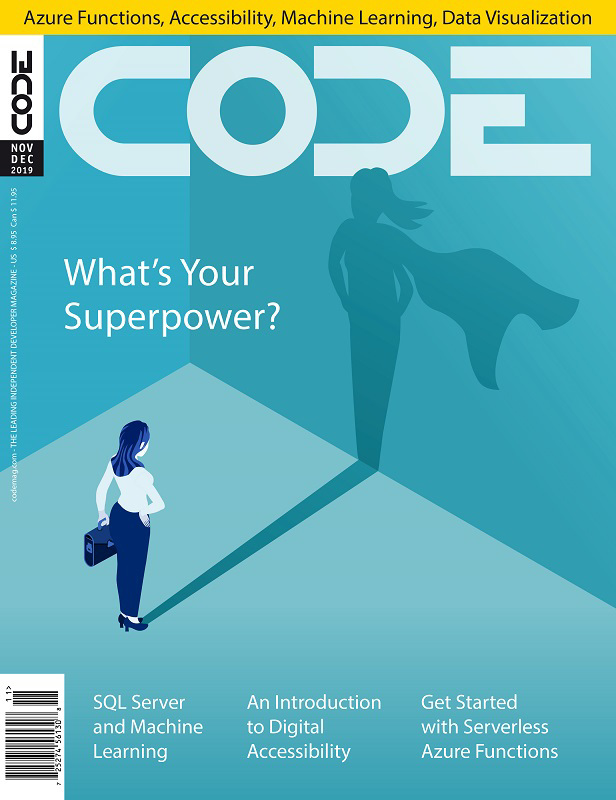
Check out my technical writing on topics like Power BI, data visualization best practices, Tableau, and Power Query in Code Magazine issues.

Data visualization best practices
//www.codemag.com/Article/1911101/Best-Practices-for-Data-Visualizations-A-Recipe-for-Success
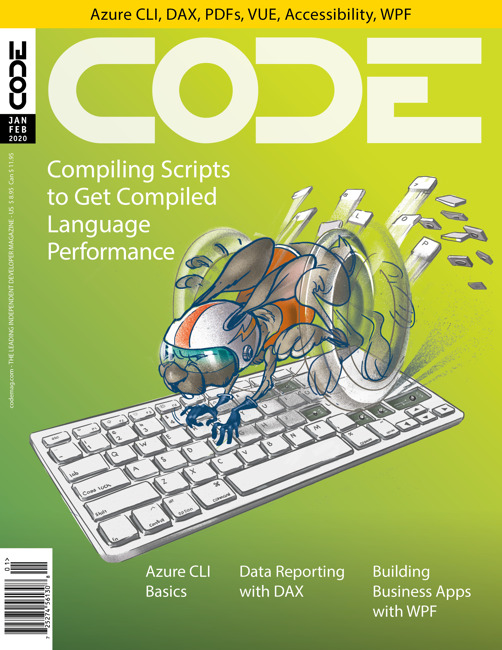
Life insurance DAX calculations in Power BI
https://www.codemag.com/Article/2001091/Financial-Modeling-with-Power-BI-and-DAX-Life-Insurance-Calculations
API’s with Power Query in Excel
https://www.codemag.com/Article/2008051/Power-Query-Excel%E2%80%99s-Hidden-Weapon
The Code Magazine image links above will take you to the pertinent article that includes a walkthrough of how to do the project step-by-step, including starting and ending state files.
Please check out my work, I would love to hear from you!
-HW