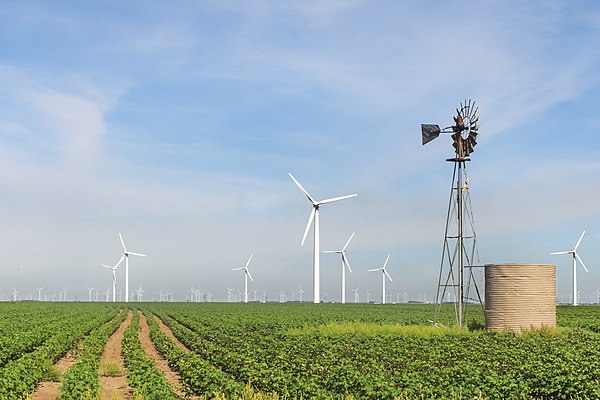
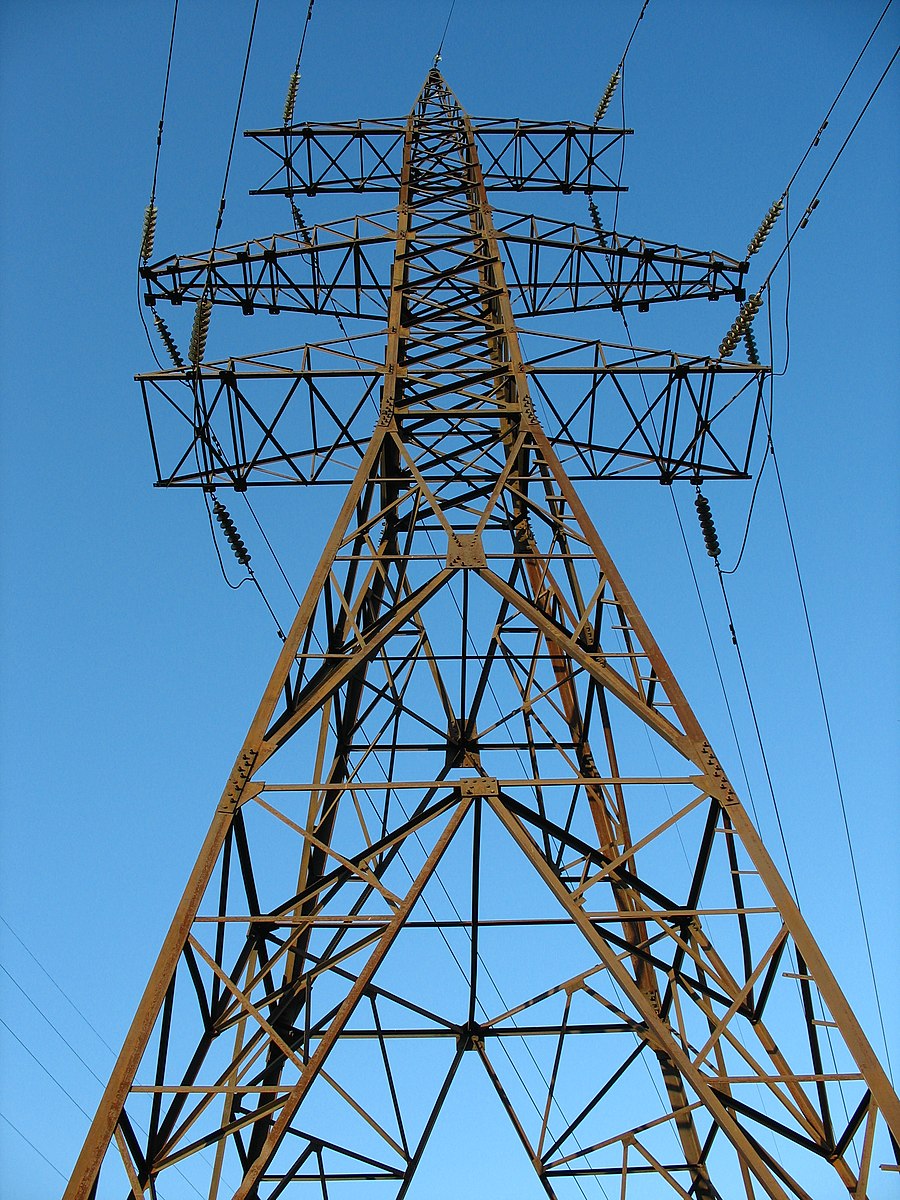
The US electricity grid is an expansive, complicated system that spans across the United States, and also into Mexico and Canada (see the map for the 2003 East Coast blackout). We can further divide the North American grid into three interconnections: Eastern, Western, and Texas. The Electricity Reliability Council of Texas (ERCOT) manages the grid as a balancing authority made up of numerous companies offering various energy sources that supply the grid. These companies don’t want to supply too much energy, but they also want to make sure they’re maintaining enough electricity to the grid customers.
In particular, the Texas grid presents an interesting case study for analyzing hourly electricity usage. Because it is both a balancing authority and an interconnection with limited connected to other sections of the US electricity grid, the electricity demand typically trends very close to the electricity generation. Thus we can analyze the amount of electricity needed to meet the power demands quite easily.
Check out the Power BI dashboard (report technically) below on the Texas electricity grid trends over the last few years. It’s updated daily and you can expand it to fit a full screen.
Check out the Power BI dashboard (report technically) on the Texas electricity grid trends over the last few years. Here’s a few of the key trends that jumped out for me:
- Solar only produces electricity when the sun is shining. Because Texas is quite a sunny place, this is a pretty consistent hourly output each day while the sun is out. After the sun goes down, solar electricity goes to zero.
- Natural gas is the top provider of electricity in Texas, but wind continues to gain ground as they continue to build more wind farms in West Texas. However, wind is a highly variable electricity source that we can’t control it’s output for.
- If you take a look at the Hourly Generation Distribution, notice that even though wind is highly variable, it still predominantly blows at night.
- So in order to make sure there’s enough electricity to power homes and businesses in Texas, natural gas (the largest energy source) serves as the backup energy source. If the wind stops blowing, they can quickly fire up a natural gas generator to meet the demand at the time.
- Nuclear is quite a steady power source, but it doesn’t amount for much of the total electricity generated. I did some research on this (and watched the HBO mini-series Chernobyl as well) and it turns out they take quite a bit of time to turn on. This means that unlike natural gas, it’s not a good backup source for wind.
- Coal at this point serves as another backup energy source, but with the concerns from the pollution from coal plants and the carbon emissions, electricity grids are phasing it out around the country.
- Finally, this data doesn’t show any data pertaining the grid scale batteries, but those will certainly become an increasing more important part of the grid in the future. Because of the movement towards renewables, the most vexing problem is how to store the excess electricity produced when it’s not needed to be available when it is needed. Batteries are one solution to this problem.

I’ll admit I didn’t know much about the US electricity grid until the Winter Storm Uri came to Texas in February 2021. Great discoveries for me seem to often come when curiosity and coincidence collide. In this case, the aftermath of the storm nudged me to explore the electricity grid data on the EIA (Energy Information Agency) website. But it also coincided with the initial phases of developing my latest LinkedIn Learning courses on Power BI with built-in AI and machine learning capabilities. But it also coincided with the initial phases of developing my latest LinkedIn Learning courses on Power BI with built-in AI and machine learning capabilities.
-HW
